
| Year | F-Strike% | Zone% |
|---|---|---|
| 2011 | 51.7% | 43.5% |
| 2012 | 54.7% | 41.4% |
| 2013 | 56.8% | 41.8% |
| 2014 | 66.7% | 59.7% |
His percentage of pitches in the strike zone is up almost 20% from past seasons and even his first pitch strike percentage is up about 10% from last year.
One of the reasons for this could be his pitch selection. Alburquerque's best pitch is his slider and while he's always thrown it at a high rate, he's throwing it even more often than in the past (according to Brooks Baseball):
| Year | 4-Seamer | Sinker | Slider |
|---|---|---|---|
2011
|
38.1%
|
4.8%
|
57.1%
|
2012
|
5.8%
|
31.4%
|
62.8%
|
2013
|
5.2%
|
29.4%
|
65.4%
|
2014
|
16.9%
|
9.1%
|
74.0%
|
This is concerning from an injury standpoint, but again it is a small sample.
Visually, this chart shows where in the strike zone he is pitching:
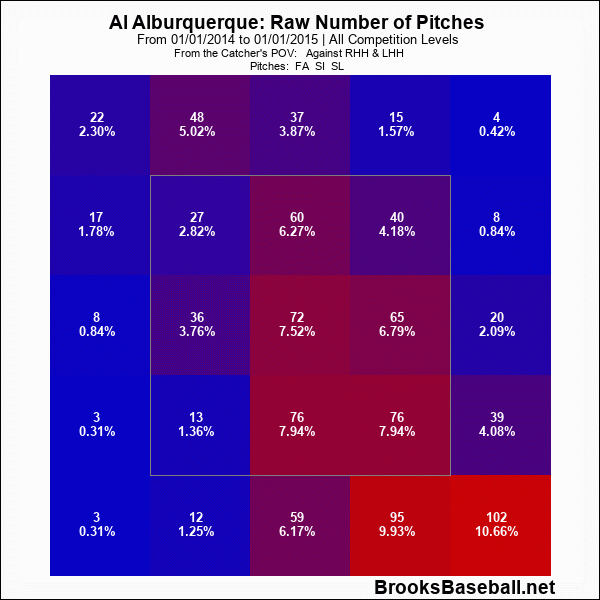
Visually, this chart shows where in the strike zone he is pitching:
Compare this to the 3 years before:

The bottom right corner is still a hot spot for Alburquerque (mostly his slider) but it can been seen in the 2014 chart there are more hot spots in the strike zone. An encouraging sign for someone prone to walking a lot of batters.
Of course when a pitcher is throwing more strikes, there is the potential for hitters to make more contact:
| Year | Contact% | Z-Contact% | O-Contact% |
|---|---|---|---|
2011
|
58.8%
|
74.4%
|
38.6%
|
2012
|
58.5%
|
66.7%
|
47.5%
|
2013
|
62.4%
|
80.3%
|
41.4%
|
2014
|
81.1%
|
92.0%
|
58.3%
|
Alburquerque has a fairly high BABIP (.333), but his line drive rate is only 15.8%, down from 25.4% last year, so batters aren't hitting him as hard as last year. So even though hitters are making more contact, they aren't making hard contact, which is a good sign. Therefore, there might be some regression here as the season goes on:
| Year | BABIP | LD% | GB% | FB% |
|---|---|---|---|---|
2011
|
0.250
|
13.6%
|
56.8%
|
29.6%
|
2012
|
0.222
|
11.1%
|
63.0%
|
25.9%
|
2013
|
0.312
|
25.4%
|
40.4%
|
34.2%
|
2014
|
0.333
|
15.8%
|
42.1%
|
42.1%
|
Visually, we can see where he's been given up the hits in the strike zone:
Alburquerque has given up 7 hits and almost half of them, 3, have been right down the middle. Maybe he's being to aggressive in throwing strikes? It's one thing to throw strikes, but you don't want to put in on a tee for batters.
Another thing that Alburquerque is doing that we're not used to seeing are low strikeouts, only 4 or 16.7%. In 2011 his strikeout rate was 36.8%; in 2012 it was 34%; and in 2013 it was 31.8%. The low strikeouts are making his Fielding Independent Pitching (FIP) look not as good as in the past:
| Year | K/9 | BB/9 | HR/9 | FIP | ERA |
|---|---|---|---|---|---|
2011
|
13.92
|
6.02
|
0.00
|
2.08
|
1.87
|
2012
|
12.15
|
5.40
|
0.00
|
2.19
|
0.68
|
2013
|
12.86
|
6.24
|
0.92
|
3.72
|
4.59
|
2014
|
6.75
|
1.69
|
1.69
|
4.55
|
5.06
|
Alburquerque showing better control and command of his pitches is a good sign. If he can keep it up, while still maintaining a low line drive rate and increase his strikeouts to where they were the last 3 years, he can possibly be one of the best relief pitchers in the league. However, it's only been a little more than 5 innings, so it could just be a blip on the radar. It's something to keep an eye on, though as the season progresses.
No comments:
Post a Comment